 | 04 Sep 2018
Preliminary studies for an integrated assessment of the hydrothermal potential of the Pechelbronn Group in the northern Upper Rhine Graben
Meike Hintze
Barbara Plasse
Kristian Bär
Ingo Sass
The northern Upper Rhine Graben is due to its tectonic setting and the positive geothermal anomaly a key region for geothermal heat and power production in Europe. In this area the Upper Eocene to Lower Oligocene Pechelbronn Group reaches depths of up to 2800 m with temperatures of locally more than 130 ∘C. In order to assess the hydrothermal potential of the Pechelbronn Group a large dataset is compiled and evaluated. Petrophysical parameters are measured on core samples of eight boreholes (courtesy of Exxon Mobil). Additionally, 15 gamma-ray logs, 99 lithology logs as well as more than 2500 porosity and permeability measurements on cores of some of these boreholes are available.
The Lower Pechelbronn Beds are composed of fluvial to lacustrine sediments, the Middle Pechelbronn Beds were deposited in a brackish to marine environment and the Upper Pechelbronn Beds consist of fluvial/alluvial to marine deposits. In between the western and eastern masterfaults of the Upper Rhine Graben several fault blocks exist, with fault orientation being sub-parallel to the graben shoulders. During the syntectonic deposition of the Pechelbronn Group these fault blocks acted as isolated depocenters, resulting in considerable thickness and depositional facies variations on the regional and local scale (few tens to several hundreds of meters).
Laboratory measurements of sonic wave velocity, density, porosity, permeability, thermal conductivity and diffusivity are conducted on the core samples that are classified into lithofacies groups. Statistically evaluated petrophysical parameters are assigned to each group. The gamma-ray logs serve to verify the lithological classification and can further be used for correlation analysis or joint inversion with the petrophysical data.
Well data, seismic sections, isolines and geological profiles are used to construct a geological 3-D model. It is planned to use the petrophysical, thermal and hydraulic rock properties at a later stage to parametrize the model unit and to determine, together with the temperature and thickness of the model unit, the expected flow rates and reservoir temperatures and thus the hydrothermal potential.
- Article
(1120 KB) - Full-text XML
- BibTeX
- EndNote


Due to the increasing awareness of the anthropogenic impact on global warming and the finite supply of fossil fuels, renewable energies play an important role in the attempted reduction of greenhouse gas emissions. The debate about alternative energy resources often focuses on the supply of electricity, even though heating accounts for approximately 55 % of the annual final energy consumption in Germany (BMWi, 2017). As opposed to other renewable energy sources, geothermal energy can be extracted regardless of the season, the time of day or the weather conditions. It can therefore be used to cover the base load, for both power and heat production depending on the extraction temperature.
The Upper Rhine Graben (URG) is due to its tectonic setting and the positive geothermal anomaly a key region for geothermal heat and power production in Europe. More than 15 geothermal wells have been drilled in the Upper Rhine Graben since the 1980ies (Vidal and Genter, 2018). Furthermore, it is one of the most densely populated areas of central Europe with an accordingly high heat demand while the rural areas are used for agriculture, which could also be extended by greenhouse farming, where geothermal heating could provide a huge potential of increase in productivity. Because of its hydrocarbon exploration history, an abundance of exploration wells and seismic surveys cover the URG. The oil and gas industry usually carries out well logging as well as porosity and permeability measurements on core samples (if available). The reservoir horizons for conventional oil and gas exploration are sandstone layers with high effective porosity and matrix permeability. Hydrothermal applications have very similar requirements and additionally require a minimum net thickness of approximately 20–50 m to allow for sufficiently sustainable flow rates (Kaltschmitt et al., 1999).
This study focusses on the Cenozoic graben fill of the northern URG as potential reservoir for direct heat use and seasonal heat storage by hydrothermal well doublets. More than 3400 porosity and permeability data of core samples for several Cenozoic units are available (Bär et al., 2013; Bär and Sass, 2015). The Upper Eocene to Lower Oligocene Pechelbronn Group was chosen for further analyses, because of the large amount of data available from various oil and gas exploration wells and the relatively high porosity and matrix permeability of its sandstone layers (Jodocy and Stober, 2011; Kött and Kracht, 2010). With depths of 1200 to 2600 m at its top (Kött and Kracht, 2010) and temperatures of locally more than 130 ∘C, the Pechelbronn Group seems suitable for geothermal applications.
The aim of this study is to assess the hydrothermal potential of the Pechelbronn Group for direct heat use by means of an integrated 3-D structural-geothermal model that serves to locate potential exploration areas. The assessment is based on reservoir temperature, (net)thickness of the reservoir horizon as well as on petrophysical, thermal and hydraulic rock properties.
We present preliminary results, as the petrophysical property measurements are still being analysed and the 3-D structural model, which is the basis for the assessment of the hydrothermal potential, is not yet completed. Nevertheless, the methodology is described for the entire workflow.
The study area is located in the northern Upper Rhine Graben (Fig. 1). In most parts of the northern Upper Rhine Graben the Pechelbronn Group covers the Rotliegend discordantly except for some locations where Eocene clays were deposited in the initial phases of taphrogenesis (e.g. Dèzes et al., 2004). The top of the Rotliegend can therefore be regarded as equivalent to the base of the Pechelbronn Group.
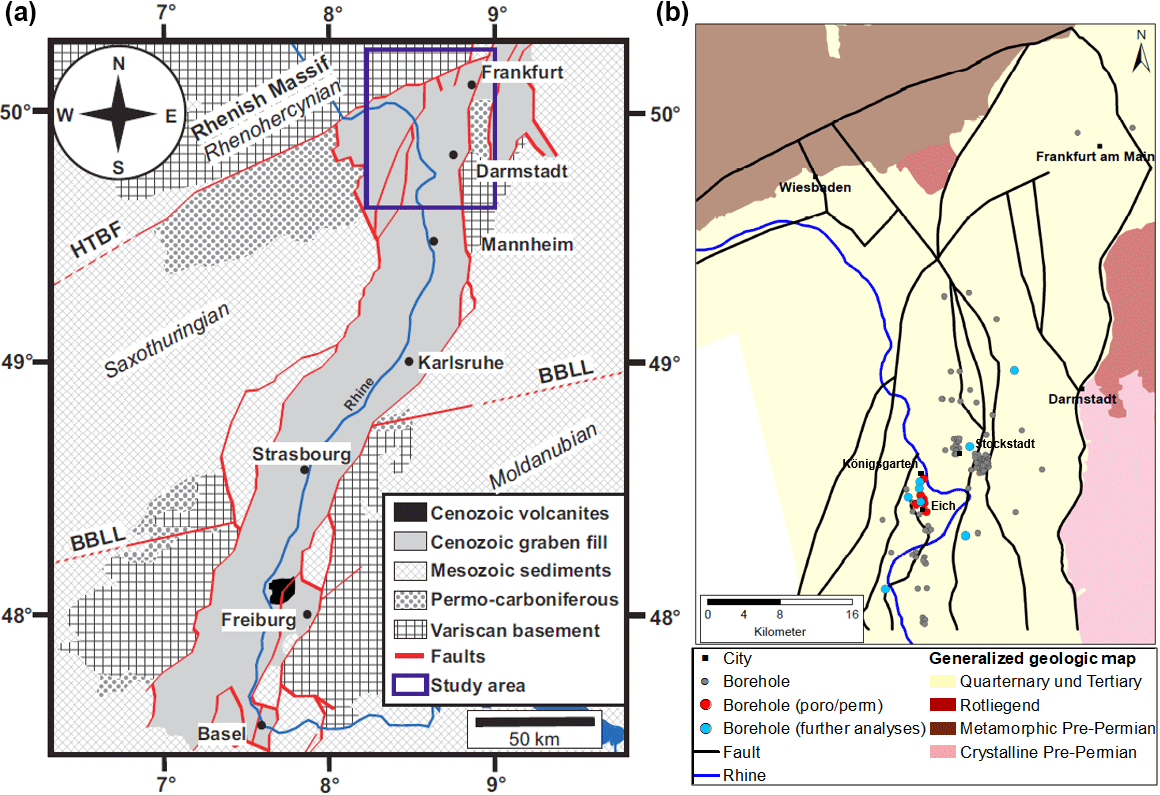
Figure 1(a) Geological overview of the Upper Rhine Graben (HTBF: Hunsrück-Taunus Boundary Fault; BBLL: Baden-Baden-Lalaye-Lubine Fault), modified after Schwarz (2006). (b) Study area with location of boreholes (16 boreholes with porosity and permeability data (red and blue), from which eight boreholes were chosen for further petrophysical analyses (blue)). The location of major faults is shown at 0 m a.s.l.
The Pechelbronn Group is subdivided into three formations according to lithostratigraphy. The Lower Pechelbronn Beds are composed of fluvial to lacustrine sediments, containing moderately to poorly sorted sandstones and conglomerates intercalated with silt- and claystone layers (Gaupp and Nickel, 2000). The upper part of the Lower Pechelbronn Beds was deposited in a brackish environment, indicating the following marine transgression in the Middle Pechelbronn Beds, which comprise brackish to marine claystones alternating with fine grained calcareous sandstones (Gaupp and Nickel, 2000). The Upper Pechelbronn Beds consist of fluvial/alluvial to brackish/marine deposits. Lithology and facies show high regional variation with alternating sequences of claystone, limestone, sandstone and conglomerate (Grimm et al., 2011). According to Gaupp and Nickel (2000) and Derer et al. (2003, 2005) a braided delta rapidly advancing eastward or southeastward from the western graben shoulder caused a relatively coarse grained clastic sedimentation in the vicinity of the proximally situated town of Eich. The distal location of the area around Königsgarten towards Stockstadt entailed brackish to lacustrine sedimentation with claystones and fine-grained calcareous sandstones (locations shown in Fig. 1).
In between the western and eastern masterfaults of the Upper Rhine Graben several fault blocks exist, with fault orientation being sub-parallel to the graben shoulders. During the deposition of the Pechelbronn Group these fault blocks acted as isolated depocenters (Derer, 2003), resulting in considerable thickness and depositional facies variations on the regional and local scale (few tens to several hundreds of meters). The differences in thickness of the Pechelbronn deposits between structural highs and lows are predominantly attributed to the thicker pelitic intervals in the depressions, whereas the conglomeratic and sandy facies of the upper part of the succession are more uniformly distributed over highs and lows (Gaupp and Nickel, 2000).
The construction of the stratigraphic horizon of the Pechelbronn Group for the 3-D structural model is based on 99 lithological well logs (locations shown in Fig. 1), most of which reached the base of the Pechelbronn Group. The fault geometry in the geological 3-D structural model is adopted from Arndt (2012) (Fig. 1) and modified where necessary in order to fit the input data. These faults are modelled based on the tectonic map of Germany (TK1000, Zitzmann, 1981), Anderle (1974) and Derer (2003). In our first modelling step the Pechelbronn Group will comprise only one model unit and should later on be further subdivided according to the three existing formations or to lithological criteria. Additional literature and other data, which could allow to consider syntectonic basin and depositional evolution and facies distribution in the modelling process to avoid a mere interpolation between the lithological well logs, is currently being compiled and reviewed.
In order to assess the hydrothermal potential of the Pechelbronn Group a large database with porosity and permeability data from more than 2500 core plugs of 16 oil and gas exploration wells with multiple core sections are available from the Geological Survey of Lower Saxony (Bär et al., 2013; Bär and Sass, 2015). This database also contains a petrographic classification. The samples used in this study are classified as claystone, siltstone, fine, medium and coarse sandstone as well as gravelly sandstone. Claystone and siltstone samples were merged into one unit during further data processing because of the small number of siltstone samples and the very similar porosity and permeability of clay- and siltstones. This petrographic classification and own petrographic core descriptions lead to the definition of five lithofacies groups, that serve to cluster the measurement results and statistically evaluate the parameters for each group.
From the 16 wells with porosity and permeability measurements eight cores were chosen for further analyses. From the existing core plugs 150 were used for measurements of thermal conductivity and diffusivity and sonic wave velocity (P and S wave velocity). The selected samples are representative for their lithofacies group in terms of lithology, porosity and permeability. The cylinder-shaped samples were drilled perpendicular to the core axis, such that the sample axis is parallel to the bedding plane. Samples have a diameter of 30 mm and lengths of 25–50 mm.
Additionally, gamma-ray logs of 15 wells were provided by Exxon Mobil and are used for correlation with lithology and the porosity and permeability data.
The workflow used for the construction of the 3-D structural model and the assessment of the hydrothermal potential is shown in Fig. 2. The structural model is built with SKUA-GOCAD™.
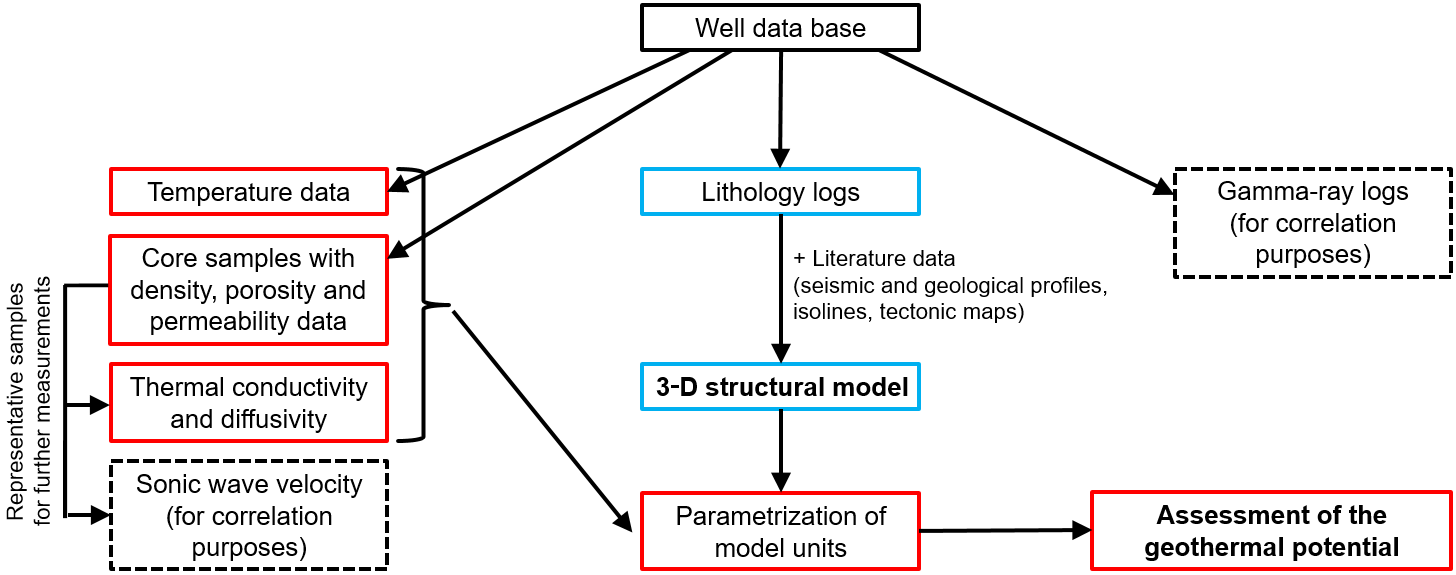
Figure 2Flowchart illustrating the input data and steps for the construction of the 3-D structural model (highlighted in blue) and the assessment of the geothermal potential (highlighted in red). Steps in dashed line boxes are only shown for completeness but are not further discussed in this paper.
4.1 Thermal conductivity and diffusivity
The measurements of the thermal conductivity and thermal diffusivity were conducted both under oven-dry and fully water saturated conditions, to be able to correct these properties to reservoir conditions. Samples were oven-dried at 60 ∘C for 48 h and saturated with de-ionized water in a vacuum desiccator for 48 h.
Bulk thermal conductivity and diffusivity were measured using the optical scanning method (Popov et al., 1983, 1999), which is based on the contactless heating of the samples and determination of the subsequent cooling rate. In order to minimize the influence of varying optical reflection, the samples are covered with a black coating of uniform thickness. The working surface is the plane bottom face of the cylinder-shaped samples. Further details on the measurement of the thermal diffusivity are given in Popov et al. (2016). According to the manufacturer Lippmann & Rauen, the device supports thermal conductivity measurements in the range of 0.2–25 Wm−1 K−1 with an accuracy of ±3 %, the accuracy for thermal diffusivity measurements is ±8 %.
4.2 Assessment of the hydrothermal potential
As indicated in Fig. 2, the measured rock and reservoir properties will be used to parametrize the 3-D structural model. The assessment of the hydrothermal potential will be carried out based on this parametrization. Parameters with the highest influence on the performance and efficiency of a hydrothermal doublet are according to Stober et al. (2016) the porosity, permeability, temperature and transmissibility. During inspection of the cores of the eight boreholes that were used for further analyses no indication of fractures in the potential reservoir could be observed. Neither do well log files mention any evidence of fractures. Hydraulic tests (if existing) are confidential and not available to the authors. According to Kött and Kracht (2010), the aquifer horizons within the Upper and Lower Pechelbronn Beds are porous aquifers. It is therefore assumed that fractures have no significant positive impact on reservoir permeability, which is thus considered to be in the same order of magnitude as the matrix permeability. This assumption might lead to an underestimation of the reservoir permeability and can thus be seen as a conservative estimate of the hydrothermal potential.
According to Eq. (1) the geothermal power (Pth) extracted by the heat exchanger depends on the heat capacity of water (cp), the temperature difference between production and injection (ΔT) and the mass flow (Qm).
Higher permeabilities and greater thicknesses yield higher flowrates (see Eq. 2). It is therefore convenient to use the transmissibility for the parametrization of the 3-D model. It is commonly assumed that hydrothermal systems require a minimum transmissibility of 5 × 10⁻¹² m2 (Stober et al., 2016). For borehole locations where there is a detailed lithology log available, the relative thickness of each lithofacies group is known. The permeability data is evaluated separately for each lithofacies group as shown in Fig. 4. The transmissibility can then be calculated for each lithofacies group. As the thickness might vary considerably from one depocenter to another, the transmissibility cannot be interpolated over the whole study area, but only within fault blocks that display (semi)isolated depocenters and only if enough data is available. Here it is planned to not only rely on the lithology logs of the wells, but also use gamma-ray logs, if available, to identify the defined lithofacies types. The inter- and extrapolation in areas without available borehole data implicate higher uncertainties.
The reservoir temperature from the temperature models of Arndt et al. (2011) and Rühaak et al. (2014) is used as production temperature. For the injection temperature three scenarios are assumed: 90 ∘C for power generation with binary power plants, 50 ∘C for direct heat production and 30 ∘C for greenhouse farming. For a given pressure difference between production and injection well (e.g. 1, 3 and 6 MPa) the flow rate can be calculated following Eq. (2) (after Van Wees et al., 2012; Mijnlieff et al., 2014), where Qv is the volumetric flow rate, ρ is the brine density, Δp is the pressure difference between the initial hydrostatic pressure in the aquifer and the well pressure, Ki is the permeability of the higher permeable lithofacies groups (that are used for the water extraction and injection), Hi is the thickness of these permeable layers, μ is the dynamic viscosity, L is the well distance, rout the outer well radius and S the skin factor (the skin factor could be used to account for deviated wells, Rogers and Economides, 1996; Mijnlieff et al., 2014).
With known flow rate the geothermal power can be calculated (Eq. 1). Here a maximum threshold for the drawdown needs to be included to ensure economic production.
5.1 Petrophysical properties
The Box-Whisker diagram in Fig. 3 shows the porosity and permeability data for core samples of 16 wells compiled by the Geological Survey of Lower Saxony (Bär et al., 2013; Bär and Sass, 2015) grouped according to the petrographic description in the database. There is an increase in porosity and permeability with increasing grain size from clay-/siltstone to coarse sandstone. Porosities of the gravelly sandstone samples are lower, which can be explained by their poor sorting.
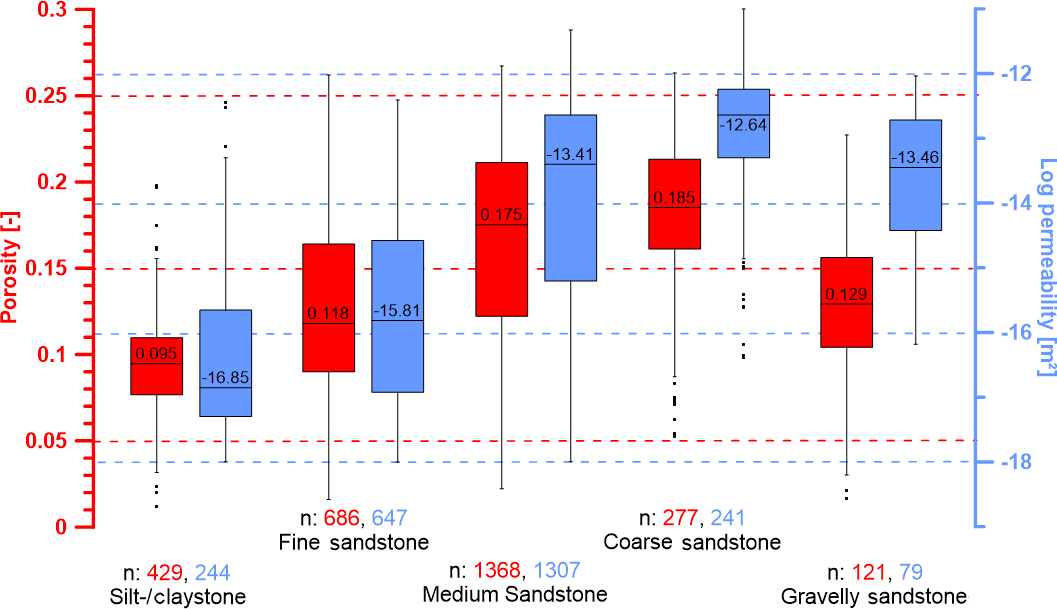
Figure 3Porosity and permeability data measured on core samples of 16 boreholes (Bär et al., 2013; Bär and Sass, 2015). Values inside the boxes show the median. n: Number of samples.
Figure 4a shows the results of the thermal conductivity measurements on oven-dry and fully water saturated samples. The medians of the dry thermal conductivity for all lithofacies groups range between 2 and 2.3 Wm−1 K−1. The trend in the saturated thermal conductivity values clearly reflects the porosity trend between the different lithofacies groups (see Fig. 3). The diagram on the right hand side of Fig. 4 shows the relationship of the thermal conductivity ratio (TCR) and the porosity. The TCR is calculated according to Eq. (3), where λsat and λdry are the thermal conductivity of the saturated and dry sample, respectively.
The coefficient of determination for a linear regression of the whole data set is 0.59. The coefficients of determination for each lithofacies group separately are given in the legend.
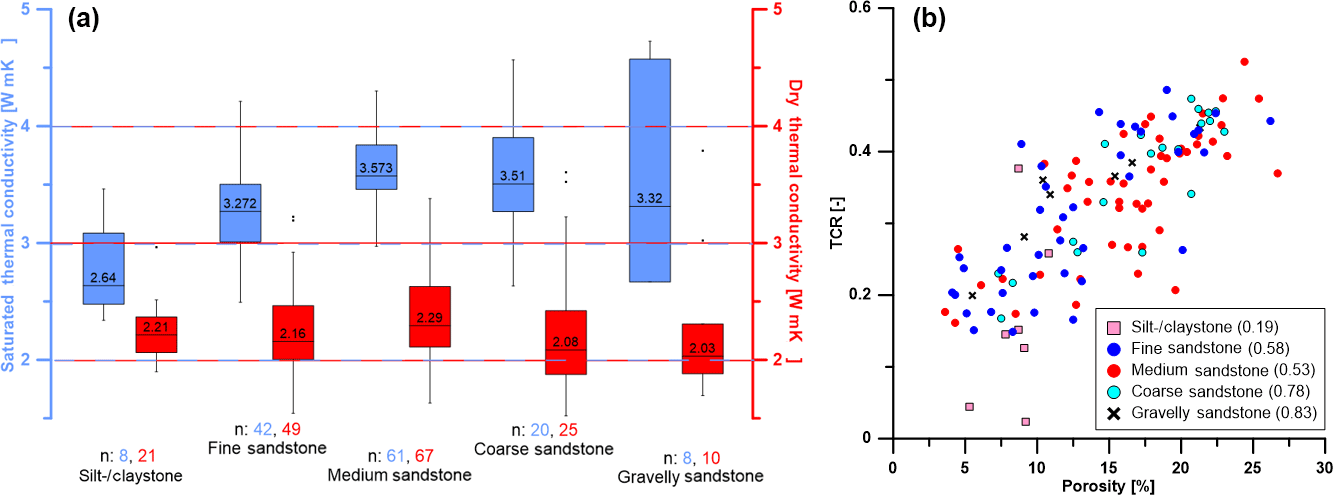
Figure 4(a) Thermal conductivity data measured on fully water saturated and oven-dry core samples of eight boreholes. The values inside the boxes show the median. n: Number of samples. (b) Thermal conductivity ratio (TCR; Eq. 3) against porosity. The values given in the legend are the coefficients of determination for a linear regression.
5.2 Correlation of gamma-ray log with lithology, porosity and permeability
Figure 5 shows the gamma-ray log together with the lithology log and the porosity and permeability data exemplarily for one borehole. The gamma-ray log is in good agreement with the lithology and shows a significant negative correlation with the porosity and permeability. These general trends are observed for all boreholes, but quantitative conclusions (in terms of correlation coefficients) still need to be drawn taking into account all available gamma-ray logs and porosity and permeability data. In the presented example the lithology log was not depth-corrected and needed to be shifted 3 m upward in order to fit the gamma-ray log. The depth is given in MD (measured depth), but the borehole penetrates the Pechelbronn Group almost vertically, so that the true vertical thickness corresponds to the penetrated thickness. It can be seen from the figure that more than 20 m of the whole section shows permeability values of more than 10−14 m2.
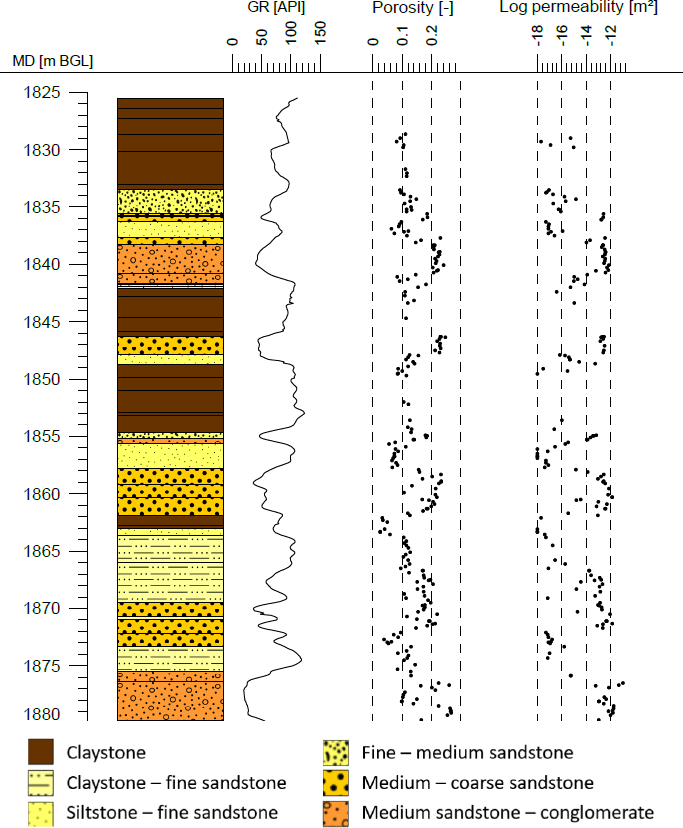
Figure 5Exemplary lithology profile, gamma-ray log (both courtesy of Exxon Mobil), porosity and permeability data (from the Geological Survey of Lower Saxony; Bär et al., 2013; Bär and Sass, 2015) of one of the analysed wells.
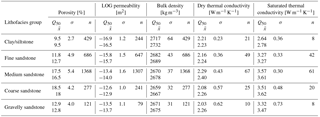
The number of samples for which porosity and permeability data are available is not evenly distributed over the different lithofacies groups. Nevertheless, the amount of measurements is sufficient for each group to provide statistically evaluated parameter and uncertainty ranges that can be used for the parametrization of the model unit. The number of thermal conductivity measurements under both oven-dry and fully water saturated conditions is much lower and results might therefore not be statistically representative. Especially for the gravelly sandstone (which is the most heterogeneous sample group in terms of lithology, grain size and sorting) the saturated thermal conductivity range is very high. However, the results of the saturated thermal conductivity measurements clearly reflect the porosity values and are therefore assumed to be reasonable. Furthermore, given the correlations shown in Fig. 4 it is reasonable to use mean values for the dry thermal conductivity and calculate saturated bulk thermal conductivity using the measured porosity values for each lithological unit.
As consequence from the fact that the thermal conductivity of water exceeds the thermal conductivity of air by a factor of approximately 23 (at room temperature) the thermal conductivity ratio increases with increasing porosity as indicated in Fig. 4b. The low coefficient of determination for Silt-/Claystones might be caused by the (different) swelling capacity of some clay minerals. Still, the number of saturated thermal conductivity measurements for this lithofacies group is too low to allow for statistically meaningful conclusions.
For the parametrization the properties have to be corrected to reservoir conditions (pressure and temperature) as suggested by Bär (2012). The assessment of the hydrothermal potential will account for uncertainties by using the upper and lower end of the parameter ranges (e.g. Q90 ∕ Q75 and Q10 ∕ Q25) as well as the median values, resulting in an optimistic, a conservative and a realistic estimation, respectively. This statistical approach also allows for the calculation of the probability of occurrence to reach a certain geothermal potential.
Table 1Average (median: Q50, arithmetic mean: property values, standard deviation (σ) and number of samples (n) for each lithofacies group.
The correlation of gamma-ray and other borehole geophysical logs with petrophysical properties can be used to give a quite satisfactory estimation of the latter if no core samples are available (e.g. Hartmann et al., 2005; Fuchs and Förster, 2014). In order to quantify the negative correlation between gamma-ray amplitude and porosity and permeability, more boreholes are currently being analyzed. The aim is to assign porosity, permeability and thermophysical property ranges to certain gamma-ray API values.
Results of porosity, permeability and thermal conductivity measurements yield statistically evaluated values for five lithofacies groups. The mean property values for each lithofacies group are shown in Table 1 together with the standard deviation.
As soon as the 3-D structural model is completed and the units are parametrized with the relevant properties, the hydrothermal potential can be assessed in 3-D. If there are areas that turn out to be sufficiently thick and permeable, these areas can be studied and modelled in more detail. Provided that there is enough lithological and structural input data, the Pechelbronn Group can be further subdivided in a local scale 3-D structural model. Additionally, a numerical model with a reasonable geological setting (probably provided by the local scale 3-D structural model) or other more simplistic approaches of geothermal well doublet calculators (Van Wees et al., 2012) would simulate a hydrothermal doublet for direct heat generation (e.g. Kastner et al., 2015). These approaches could also be used for a sensitivity analysis to better assess the impact of over- or underestimation of each property on the performance and efficiency of such an application.
Due to confidentiality reasons the data is not publicly available.
The porosity and permeability measurements were not conducted by the authors, but by the borehole operator(s). The authors did the statistical evaluation of the porosity and permeability data. Other measurments on core sample (dry and saturated thermal conductivity, p and s wave velocity) were conducted and evaluated by the authors. The gamma-ray logs and lithology logs were provided by ExxonMobile Production Deutschland GmbH and reprocessed by the authors. The 3-D structural-geothermal model is being constructed by the authors.
The authors declare that they have no conflict of interest.
This project receives funding from the Federal Ministry for Economic Affairs
and Energy (grant agreement no. 0325944 A) and support by the DFG in the
framework of the Excellence Initiative, Darmstadt Graduate School of
Excellence Energy Science and Engineering. We also thank the EMPG (ExxonMobil
Production Deutschland GmbH) for providing core samples, geophysical borehole
logs and porosity and permeability data.
Edited by: Viktor Bruckman
Reviewed by: Robert Ondrak and one anonymous referee
Anderle, H.-J.: Block Tectonic Interrelations between Northern Upper Rhine Graben and Southern Taunus Mountains, in: Approaches to Taphogenesis – Proceedings of an International Rift Symposium held in Karlsruhe April 13–15, 1972, edited by: Illies, J. H. and Fuchs, K., Schweizerbart, 243–253, 1974.
Arndt, D.: Geologische Strukturmodellierung von Hessen zur Bestimmung von Geopotenzialen, Ph.D. thesis, TU Darmstadt, Germany, 199 pp., 2012.
Arndt, D., Bär, K., Fritsche, J.-G., Kracht, M., Sass, I., and Hoppe, A.: 3D structural model of the Federal State of Hesse (Germany) for geo-potential evaluation, Z. dt. Ges. Geowiss., 162, 353-370, Stuttgart (Schweizerbart), 2011.
Bär, K. and Sass., I.: New Concept for the application of Outcrop Analogue Data for Geothermal Probability of Success (POS) Studies – Examples of Projects in the Northern Upper Rhine Graben (Germany). Proceedings World Geothermal Congress 2015, Melbourne Australia, 19–25 April 2015.
Bär, K., Arndt, D, Hoppe, A., and Sass, I.: Investigation of the deep geothermal potentials of Hesse (Germany). Proceedings of the European Geothermal Congress 2013, Pisa, Italy, 2013.
Bundesministerium für Wirtschaft und Energie (BMWi): Endenergieverbrauch nach Anwendungsbereichen (Stand Nov. 2017), Berlin, Germany, 2017, available at: https://www.bmwi.de/Redaktion/DE/Artikel/Energie/energiedaten-gesamtausgabe.html last access: May 2018.
Derer, C. E.: Tectono-Sedimentary Evolution of the Northern Upper Rhine Graben (Germany) with special regards to the early-synrift stage, Ph.D. thesis, Rheinische Friedrich-Wilhelm Universität Bonn, Germany, 103 pp., 2003.
Derer, C. E., Kosinowski, M., Luterbacher, H.-P., Schäfer, A., and Süß, M. P: Sedimentary response to tectonics in extensional basins: the Pechelbronn Beds (late Eocene to early Oligocene) in the northern Upper Rhine Graben, Germany, McCann, T. and Saintot, A.: Tracing Tectonic Deformation Using the Sedimentary Record, Geological Society Special Publications, 208, 55–69, 2003.
Derer, C. E., Schumacher, M. E., and Schäfer, A.: The northern Upper Rhine Graben: basin geometry and early syn-rift tectono-sedimentary evolution, edited by: Behrmann, J. H., Ziegler, P. A., Schmid, S. M., Heck, B., and Granet, M., EUCOR-URGENT Upper Rhine Graben Evolution and Neotectonics.-Int. J. Earth Sci. (Geol. Rundsch), 94, 640–656, Berlin, 2005.
Dèzes, P., Schmid, S., and Ziegler, P. A.: Evolution of the European Cenozoic Rift System: interaction of the Alpine and Pyrenean orogens with their foreland lithosphere, Tectonophysics, 389, 1–33, 2004.
Fuchs, S. and Förster, A.: Well-log based prediction of thermal conductivity of sedimentary successions: a case study from the North German Basin, Geophys. J. Int. 196, 291–311, 2014.
Gaupp, R. and Nickel, B.: Die Pechelbronn-Schichten im Raum Eich-Stockstadt (Nördlihcer Oberrheingraben; Blatt 6216 Gernsheim), Geol. Jb. Hessen, 128, 19–27, 2001.
Grimm, M. C., Wielandt-Schuster, U., Hottenrott, M., Grimm, K.I., and Radtke, G. with contributions of Berger, J.-P. Ellwander, D. Harms, F.-J., Hoselmann, C., Picot, L., and Weidenfeller, M.: Regionalgeologische Darstellungen, In: Deutsche Stratigraphische Kommission (Ed.): Stratigraphie von Deutschland IX. Tertiär, Teil I, Schriftenreihe der Deutschen Gesellschaft für Geowissenschaften, 75, 57–132, Hannover, 2011.
Hartmann, A., Rath, V., and Clauser, C.: Thermal conductivity from core and well log data, Int. J. Rock Mech. Mining Sci. 42, 1042–1055, 2005.
Jodocy, M. and Stober, I.: Porositäten und Permeabilittäten im Oberrheingraben und Südwestdeutschen Molassebecken, Erdöl, Erdgas, Kohle, 127, 20–27, 2011.
Kaltschmitt, M., Huenges, E., Wolff, H., Baumgärtner, J., Hoth, P., Kayser, M., Sanner, B., Schallenberg, K., Jung, R., Scheytt, T., and Lux, R. (Eds.): Energie aus Erdwärme, Spektrum Akademischer Verlag, 280 pp., 1999.
Kastner, O., Sippel, J., and Zimmermann, G.: Regional-scale assessment of hydrothermal heat plant capacities fed from deep sedimentary aquifers in Berlin/Germany, Geothermics, 53, 353–367, 2015.
Kött, A. and Kracht, M.: Möglichkeiten der CO2-Speicherung in tiefen Aquiferen Hessens, in: Müller, C., and Reinhold, K. (Eds.): Geologische Charakterisierung tiefliegender Speicher- und Barrierehorizonte in Deutschland – Speicherkataster Deutschland, Schriftenreihe der Deutschen Gesellschaft für Geowissenschaften, 74, 165–187, Hannover, 2010.
Mijnlieff, H., Obdam, A., Van Wees, J. D., Pluymaekers, M., and Veldkamp, J.: DoubletCalc 1.4 manual, TNO report, TNO 2014 R11396, 54 pp., 2014.
Popov, Y. A., Semionov, V. G., Korosteliov, V. M., and Berenzin, V. V.: Noncontact Evaluation of Thermal Conductivity of Rocks with the Aid of a Mobile Heat Source, Izvestiya, Phys. Solid Earth, 19, 563–567, 1983.
Popov, Y. A., Pribnow, F. C., Sass, J. H., Williams, C. F., and Burkhardt, H.: Characterization of the rock thermal conductivity by high-resolution optical scanning, Geothermics, 28, 253–276, 1999.
Popov, Y. A., Beardsmore, G., Clauser, C., and Roy, S.: ISRM Suggested Methods for Determining Thermal Properties of Rocks from Laboratory Tests at Atmospheric Pressure, Rock Mech. Rock Eng., 49, 4179–4207, 2016.
Rogers, E. J. and Economides, M. J.: The skin due to slant of deviated wells in permeability-anisotropic reservoirs, Soc. of Petrol. Engineers, International Conference on Horizontal Well Technology, 18–20 November, Calgary, Alberta, Canada, 1996.
Rühaak, W., Bär, K., and Sass, I.: Combining numerical modeling with geostatistical interpolation for an improved reservoir exploration, Energy Proc., 59, 315–322, 2014.
Stober, I., Fritzer, T., Obst, K., Agemar, T., and Schulz, R.: Tiefe Geothermie – Grundlagen und Nutzungsmöglichkeiten in Deutschland, edited by: LIAG – Leibniz Institut für Angewandte Geophysik, Hannover, 88 pp., 2016.
Van Wees, J. D., Kronimus, A., van Putten, M., Pluymaekers, M. P. D., Mijnlieff, H., van Hooff, P., Obdam, A., and Kramers, L.: Geothermal aquifer performance assessment for direct heat production – Methodology and application to Rotliegend aquifers, Netherlands J. Geosci., 91, 651–665, 2012.
Vidal, J. and Genter, A.: Overview of naturally permeable fractured reservoirs in the central and southern Upper Rhine Graben: Insights from geothermal wells, Geothermics, 74, 57–73, 2018.
Zitzmann, A.: Tektonische Karte der Bundesrepublik Deutschland 1:1.000.000, Bundesanstalt für Geowissenschaften und Rohstoffe, Hannover, 1981.