 | 14 Aug 2018
A stochastic model for the hourly solar radiation process for application in renewable resources management
Giannis Koudouris
Panayiotis Dimitriadis
Theano Iliopoulou
Nikos Mamassis
Demetris Koutsoyiannis
Since the beginning of the 21st century, the scientific community has made huge leaps to exploit renewable energy sources, with solar radiation being one of the most important. However, the variability of solar radiation has a significant impact on solar energy conversion systems, such as in photovoltaic systems, characterized by a fast and non-linear response to incident solar radiation. The performance prediction of these systems is typically based on hourly or daily data because those are usually available at these time scales. The aim of this work is to investigate the stochastic nature and time evolution of the solar radiation process for daily and hourly scale, with the ultimate goal of creating a new cyclostationary stochastic model capable of reproducing the dependence structure and the marginal distribution of hourly solar radiation via the clearness index KT.
- Article
(4925 KB) - Full-text XML
- BibTeX
- EndNote


Human activities are either explicitly or implicitly linked with the dynamic behaviour of the solar radiation process. As a result, during the last two decades extensive research (Ettoumi et al., 2002; Tovar-Pescador, 2008; Reno et al., 2012; Tsekouras and Koutsoyiannis, 2014) has been carried out into the stochastic nature of the solar radiation process (e.g. marginal distribution, dependence structure etc.). Although many popular distributions, used in geophysics such as (Gamma, Pareto, Lognormal, Logistic, mixture of two Normal etc.) are suggested in the literature (Ayodele and Ogunjuyigbe, 2015; Jurado et al., 1995; Aguiar and Collares-Pereira, 1992; Hollands and Huget, 1983) and may exhibit a good fit, they cannot adequately fit the right tail of the distribution. This can be explained, considering that the right boundary of the process varies at a seasonal scale. Also, the maximum value of solar radiation that can be measured at the earth surface is the solar constant (i.e. Gsc=1367 W m−2) and therefore, distributions which are not right bounded should not be applied for solar radiation. Koudouris et al. (2017) introduce a new marginal distribution (i.e. Kumaraswamy distribution) for daily solar radiation process which is verified by three goodness of fit tests. The Kumaraswamy distribution may not be a very popular distribution, but it originates from the Beta family of distributions (Jones, 2009) and exhibits some technical advantages in modelling, e.g. invertible closed form of the cumulative distribution function:
where is standardized according to , with zmin and zmax are minimum and maximum values determined from the empirical time series.
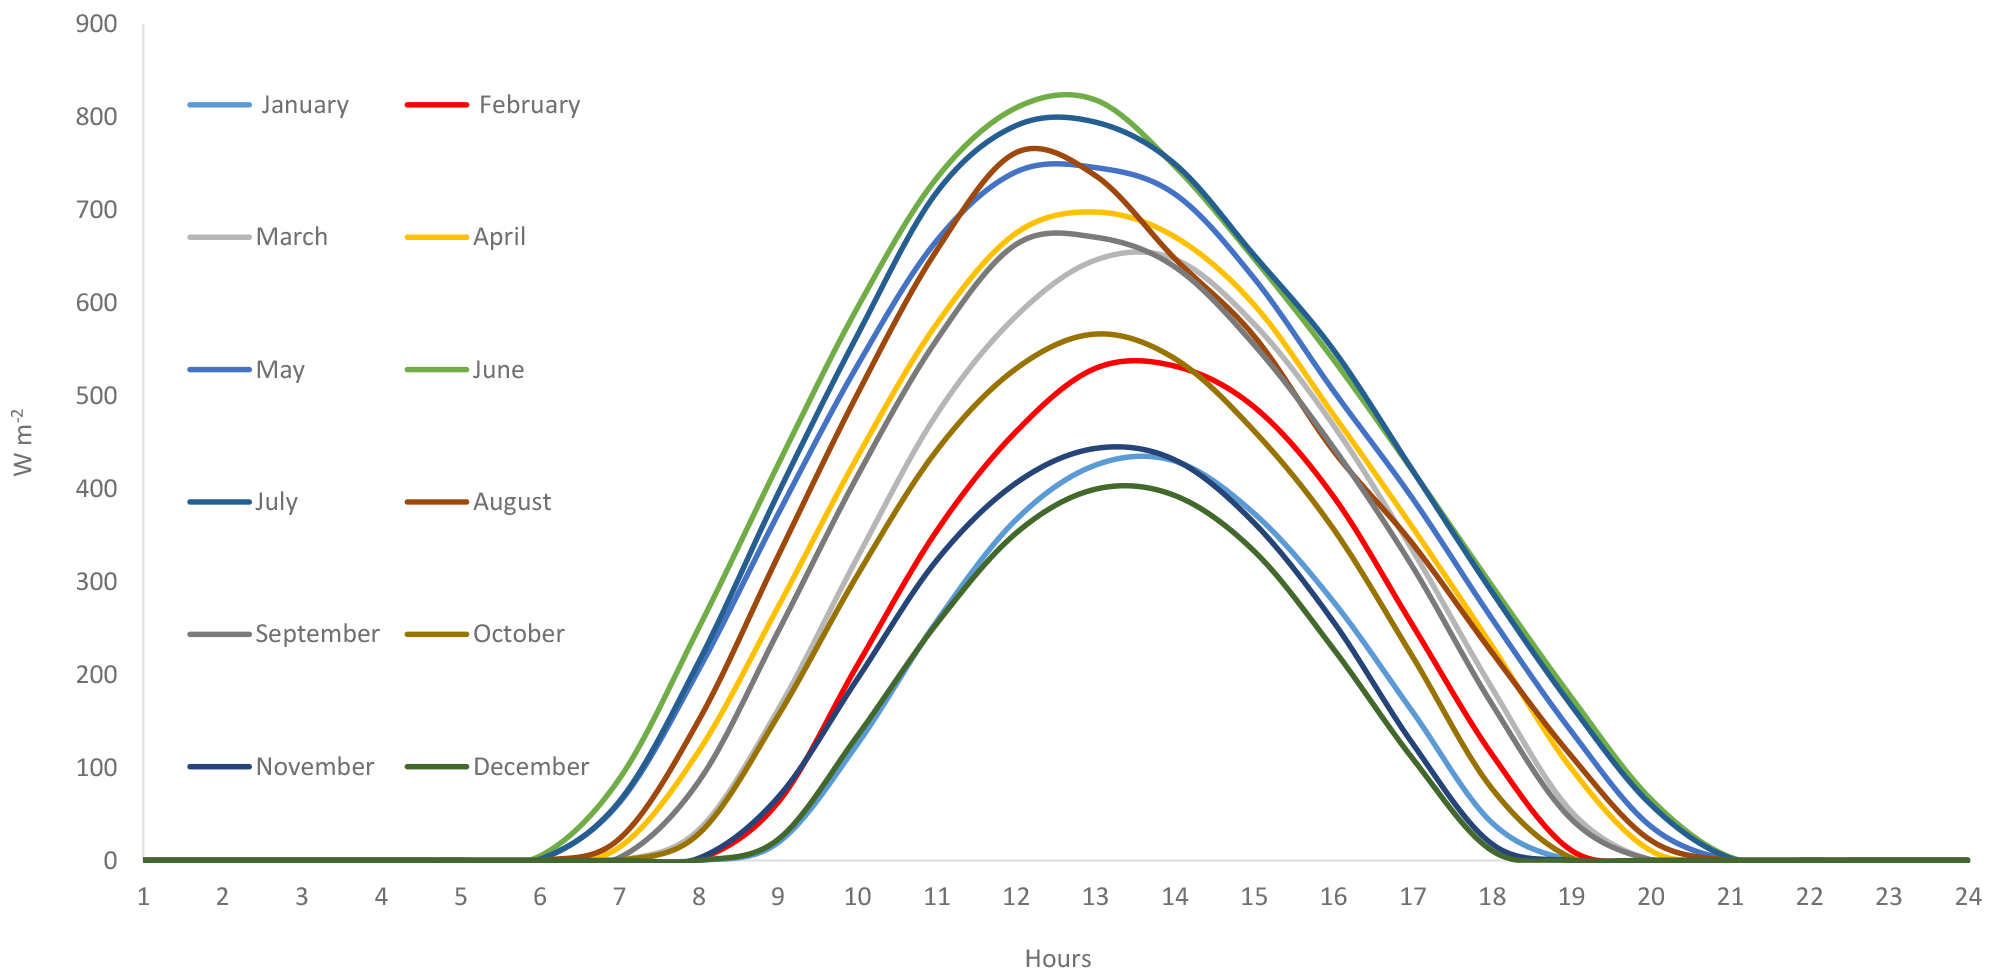
Figure 1Double periodicity diagram of Solar radiation (i.e. averaged measured value for each hour) for Denver station.
In this research framework a more extensive analysis is being conducted for hourly solar radiation. The marginal distribution for hourly scale and the dependence structure of the examined process are being investigated with the ultimate goal to synthesize a preliminary cyclostationary stochastic model capable of generating synthetic series calibrated from regional climate data. Furthermore, one the most common characteristics of hydrometeorological processes is the double periodicity (i.e. the diurnal and seasonal variation of the process); therefore, solar radiation exhibits same behaviour (e.g. Fig. 1). The seasonality occurs due to the deterministic movement of the earth in orbit around the sun and around its axis of rotation.
In order to proceed to the hourly scale data analysis, the double periodicity must be deduced from the measured data. To achieve that, the clearness index KT is introduced Eq. (2)
The index can be considered as a ratio of both deterministic and stochastic elements. The clearness index KT, describes all the meteorological stochastic influences (e.g. cloudiness, dew point, temperature, atmospheric aerosols) as it is the ratio of the actual solar radiation measured on the ground I, to that available at the top of the atmosphere I0 and so it accounts for the transparency of the atmosphere.
The denominator of Eq. (2) is a deterministic process, which can be determined from
where d is the solar eccentricity (Eq. 4), Gsc is the solar constant, ω is the hour angle (Eq. 5), φ is the latitude and δ is the declination (Eq. 6); these quantities are given as
where J=1 and 365 refer to 1 January and 31 December, respectively;
where St is the solar time, so between successive hours ;
Therefore, investigating the stochastic nature of clearness index KT can lead to conclusions for the fluctuations in hourly solar radiation.
The analysis of hourly solar radiation is conducted via the clearness index KT. In order to examine the process behaviour on a world-wide scale, data from both United States of America and Greece are examined. Data for Greece were retrieved from the Hydrological Observatory of Athens (HOA). The network consists of more than 10 stations located in Attica region measuring environmental variables of hydrometeorological interest. Each station is equipped with a data logger which records with 10 min interval. These measurements were aggregated to mean hourly data through the open software “Hydrognomon” (http://hydrognomon.org, last access: 9 August 2018). For the Attica region, the KT timeseries were generated utilizing Eq. (3) by producing hourly solar top of atmosphere intensity at the local station. For USA, the data base of NRLE (National Renewable Energy Laboratory)-NSRDB (National Solar Radiation Database) was used, which contains more than 1500 stations with hourly solar radiation, but only 40 of them include time series with more than 14 years of measurements of hourly global solar radiation measured on horizontal surface.
3.1 Marginal distribution
According to previous research (Koudouris et al., 2017), daily solar radiation can be modelled by the Kumaraswamy distribution Eq. (1). A new investigation for the hourly marginal distribution of hourly solar radiation is being conducted through the clearness index KT. Firstly, for every examined station, the hourly empirical data KT is divided into 288 times series (i.e. 24 hourly time series for each month which are constructed with approximately 30 observations during days for a certain number of years). This technique is usually found to be sufficient allowing the construction of a stationary model for the solar radiation time series. The Kumaraswamy distribution is fitted to the empirical data of the clearness index, to evaluate the statistical properties of the solar data under study. Furthermore, three goodness of fit tests (Marsaglia and Marsaglia, 2004; Csorgo and Farway, 1996; Burnham and Anderson, 2003) were applied (i.e. Kolmogorov-Smirnov, Cramer von Misses and the Anderson Darling) by setting the significance level at 5 %. For the Psyttalia station (Greece), from the 288 times series only 170 are considered with a mean value of solar radiation much larger than zero (0, 1367], as a result of the absence of the sunshine during the night period. We calculated that for only 44 of them the Kumaraswamy distribution is appropriate. The empirical probability distributions that were constructed for these results, seem to indicate that the clearness index and therefore the solar radiation exhibit a bimodal behaviour. As a result, from the analysis of all HOA network stations, the Kumaraswamy distribution cannot describe the empirical data sufficiently well and thus it is an insufficient distribution for modelling hourly solar radiation in the Attica region. Nevertheless, the empirical probability distributions that were constructed from NSRDB stations indicate that hourly solar radiation does not always exhibit a bimodal behaviour at any geographic location. This is due to the fact that hourly solar radiation is extremely correlated with the cloudiness process. Consequently, in regions where the cloudiness process does not exhibit fluctuations in small time scales, the Kumaraswamy distribution seem to adequately fit the hourly empirical data. This assumption is confirmed after investigating the marginal distribution of the clearness index at the Barrow station in Alaska where cloudiness does not exhibit a highly varying behaviour in contrast to the Attica region. For a better representation of the multivariate analysis scenarios of clearness index, a linear combination of Kumaraswamy distributions is proposed. A new distribution is constructed considering the sum of two Kumaraswamy distributions conventionally chosen and weighted by a parameter . The probability distribution and density functions of the proposed distribution are:
The parameters are calculated via the least square estimator method or the maximum likelihood estimation. The resulting f(x) and F(x) exhibit good agreement with the empirical ones (e.g. Fig. 2),notably when solar radiation exhibits a bimodal behaviour (e.g. Fig. 2c, b).
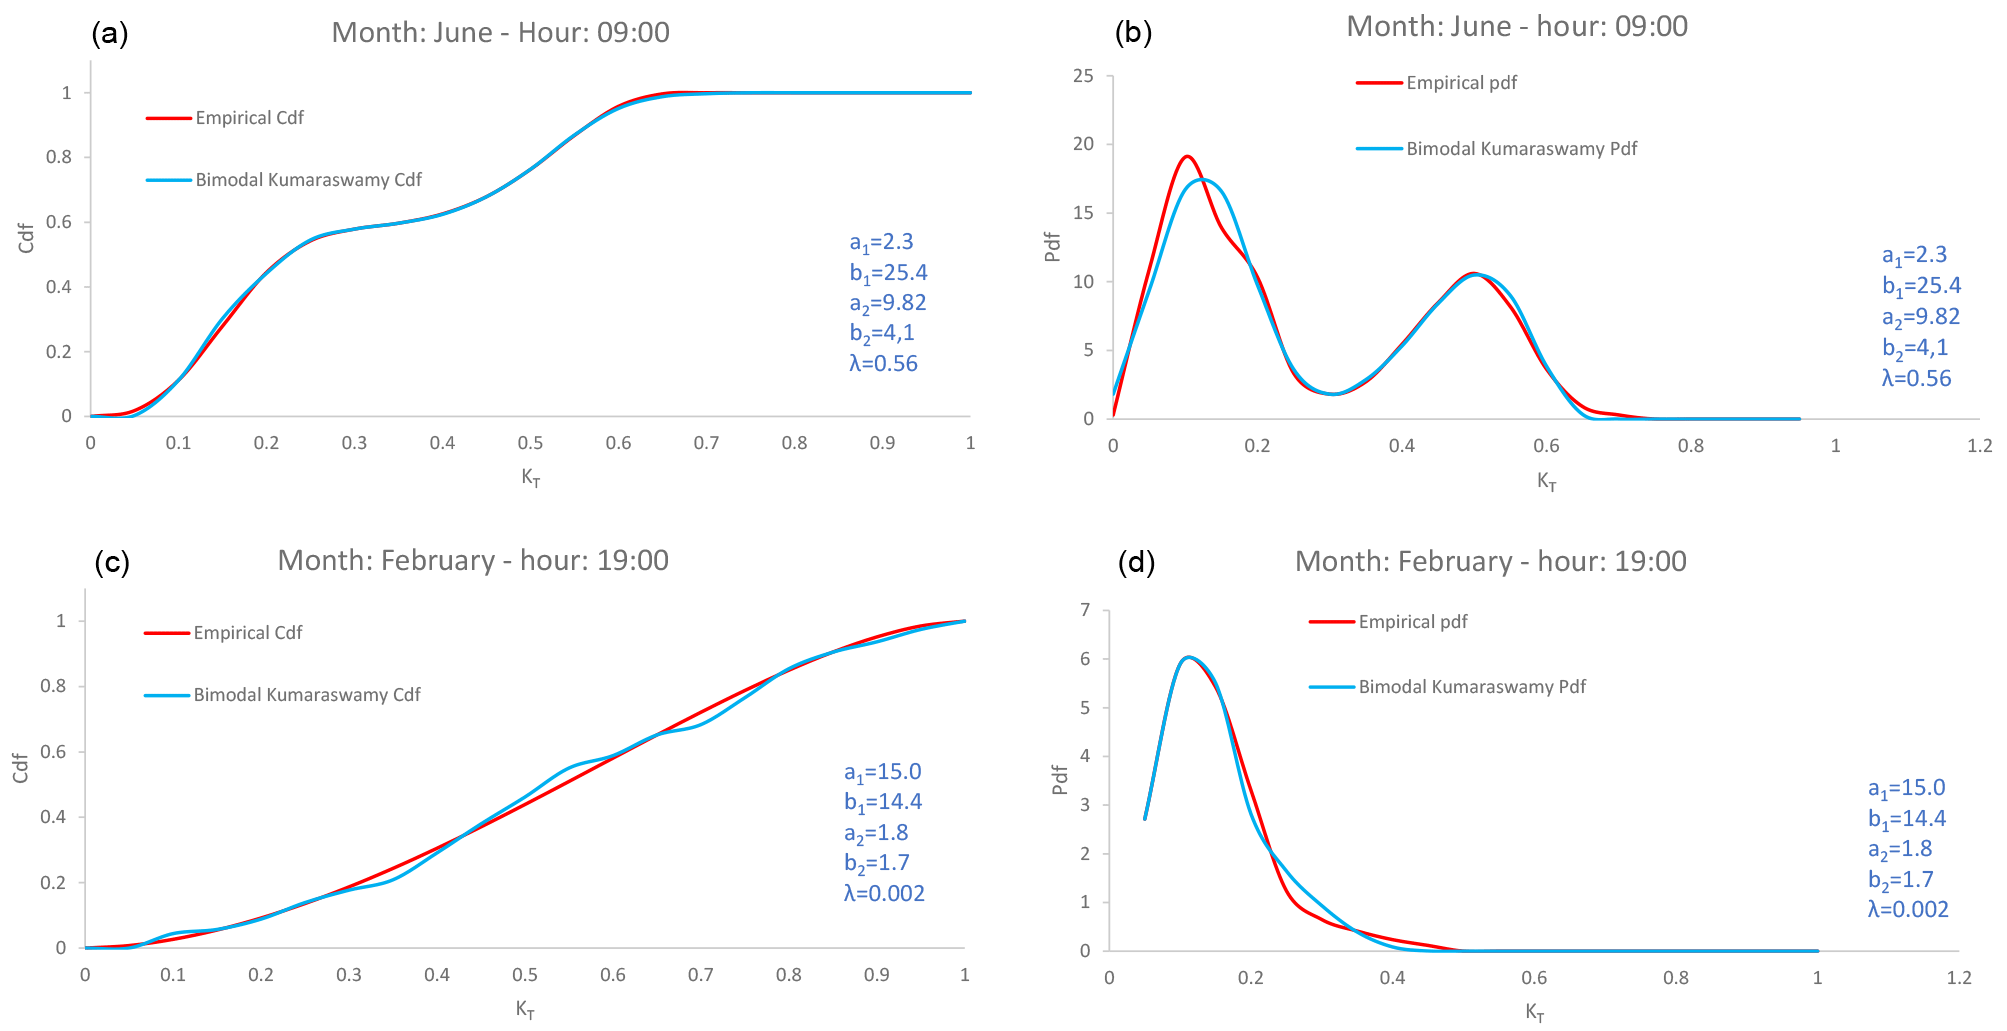
Figure 2Examples of comparison between empirical and theoretical distribution, where the latter is a linear combination of Kumaraswamy distributions. (a, b) Psitallia station, Greece (bimodal); (c, d) Barrow station, Alaska (unimodal).
3.2 Dependence structure
It is well known from the literature that hydrometeorological processes show a large variability (often linked to the maximum entropy; Koutsoyiannis, 2011) at different time scales, exhibiting so-called long-term persistence (LTP) or else the Hurst-Kolmogorov dynamics (Koutsoyiannis, 2002). In order to investigate if solar radiation exhibits an LTP behaviour, the Hurst parameter (representing the dependence structure of the process) is estimated via the climacogram tool (i.e. double logarithmic plot of variance of the averaged process versus averaging time scale k; Koutsoyiannis, 2010). The Hurst parameter is identified only at large scales. Thus, in Fig. 3, it is identified for time scales >1 year (8760 h), where the seasonal variation is averaged out and equals the half slope of the climacogram, as scale tends to infinity, plus 1. The climacogram has some important statistical advantages if compared to the autocovariance and power spectrum (Dimitriadis and Koutsoyiannis, 2015a; Harrouni et al., 2005). Exploiting the Hurst parameter, the persistence behaviour of the process is quantified and examined. The analysis of both NSRDB and HOA stations estimates the Hurst parameter larger than 0.5 (where the latter value corresponds to a white-noise behaviour); consequently, the examined process indicates long-term persistence and cannot be considered as white noise nor a Markov process.
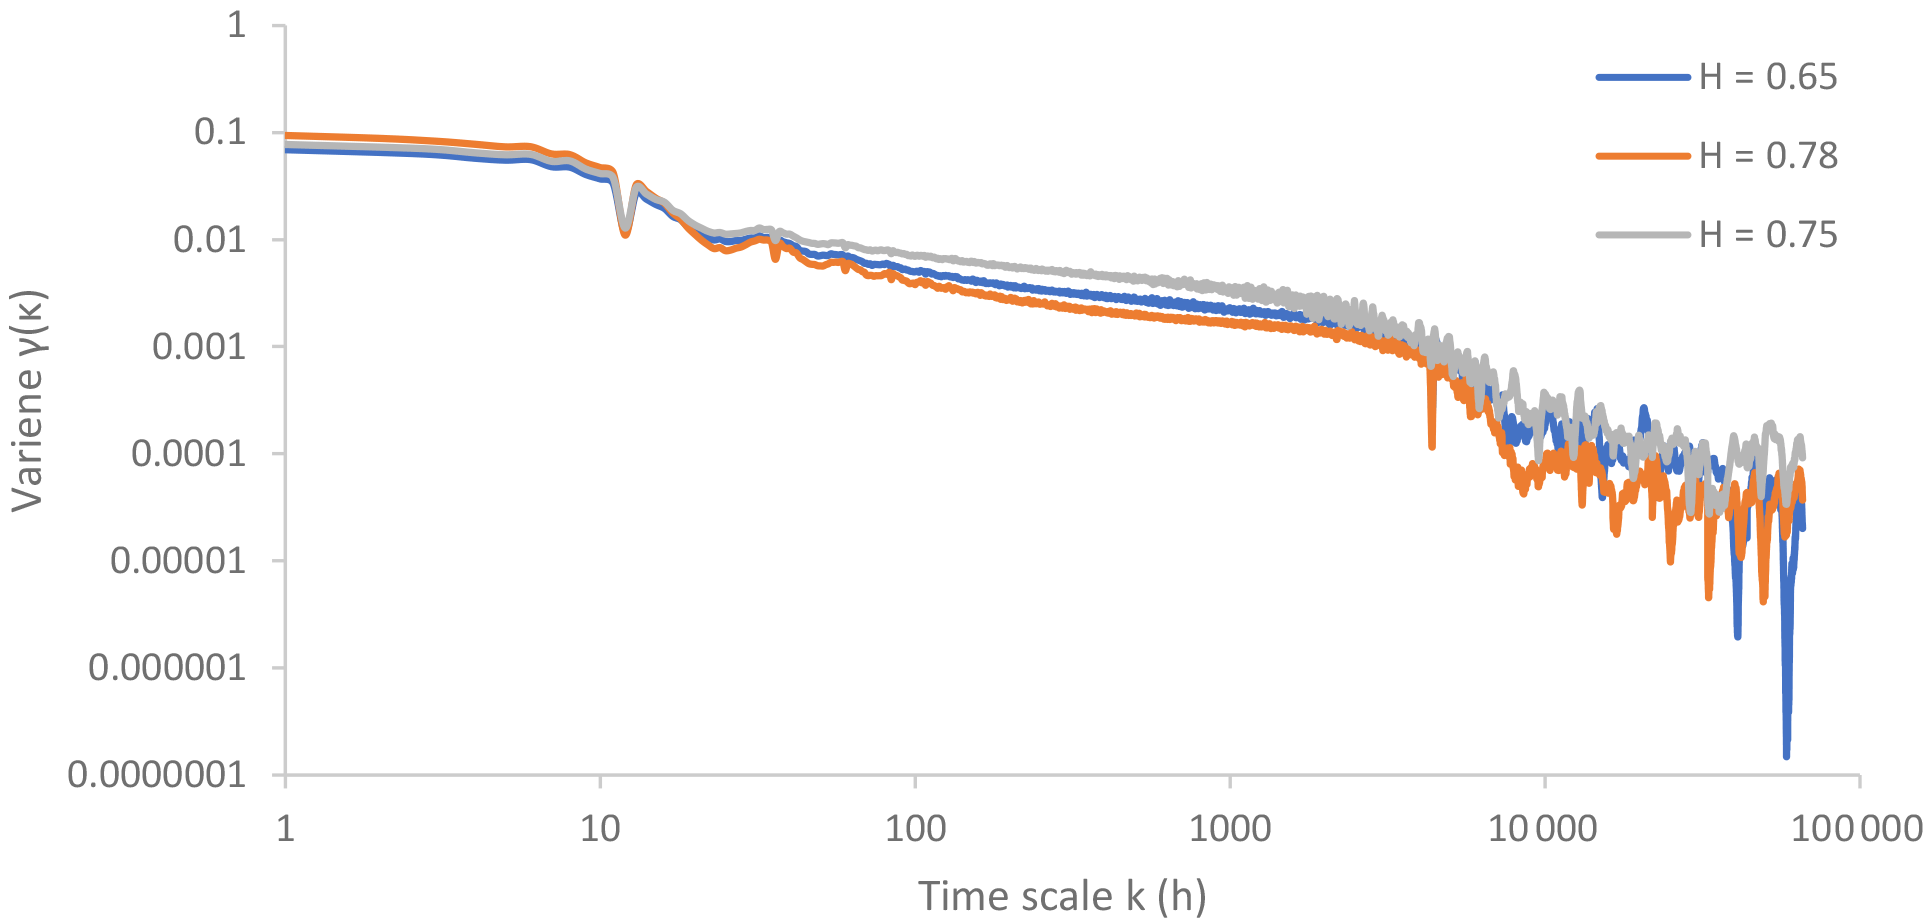
Figure 3Climacogram of three investigated stations: Denver, H=0.78, Elizabeth city, H=0.75, Bluefield Virginia, H=0.64.

Figure 4Results of the simulation model for the Denver Station: (a) 2-year synthetic timeseries of hourly KT; (b) yearly average of hourly solar radiation observations vs. synthetic values of 15 years simulation.
In this section, we describe a simple methodology to produce synthetic hourly solar radiation. After we cautiously select a marginal distribution model (e.g., Eq. 8, Fig. 5), we estimate the distribution parameters pi,j for each diurnal-seasonal process xi,j (e.g., 12×24 different set of parameters; Fig. 4). Then we homogenize the timeseries (Dimitriadis, 2017) by applying the distribution function to each one of the diurnal-seasonal processes (with the estimated, e.g. , set of parameters pi,j) and then, by employing the standard Gaussian (or any other) distribution function to each diurnal-seasonal process, i.e. . Note that in case the diurnal-seasonal processes are all Gaussian, the proposed homogenization is equivalent to the standard normalization scheme, where for each process the mean is subtracted and the residual is divided by the standard deviation.
In this implicit way, we manage to homogenize the timeseries to . In case where the marginal distribution is unknown or difficult to estimate, we may use non-linear transformation schemes based on the maximization of entropy (Koutsoyiannis et al., 2008; Dimitriadis and Koutsoyiannis, 2015b). It is noted that a more robust approach to reduce the 12×24 set of parameters would be to employ an analytical expression for the double solar periodicity (as done for the wind process in Deligiannis et al., 2016). This homogenization scheme has been applied to several processes such as wind (Deligiannis et al., 2016), solar radiation (Koudouris et al., 2017), wave height, wave period and wind for renewable energy production (Moschos et al., 2017), river discharge (Pizarro et al., 2018) and precipitation (Dimitriadis and Koutsoyiannis, 2018). However, it is noted that this scheme assumes stationary in the dependence structure rather cyclostationary (for such analyses see Koutsoyiannis et al., 2008, and references therein).
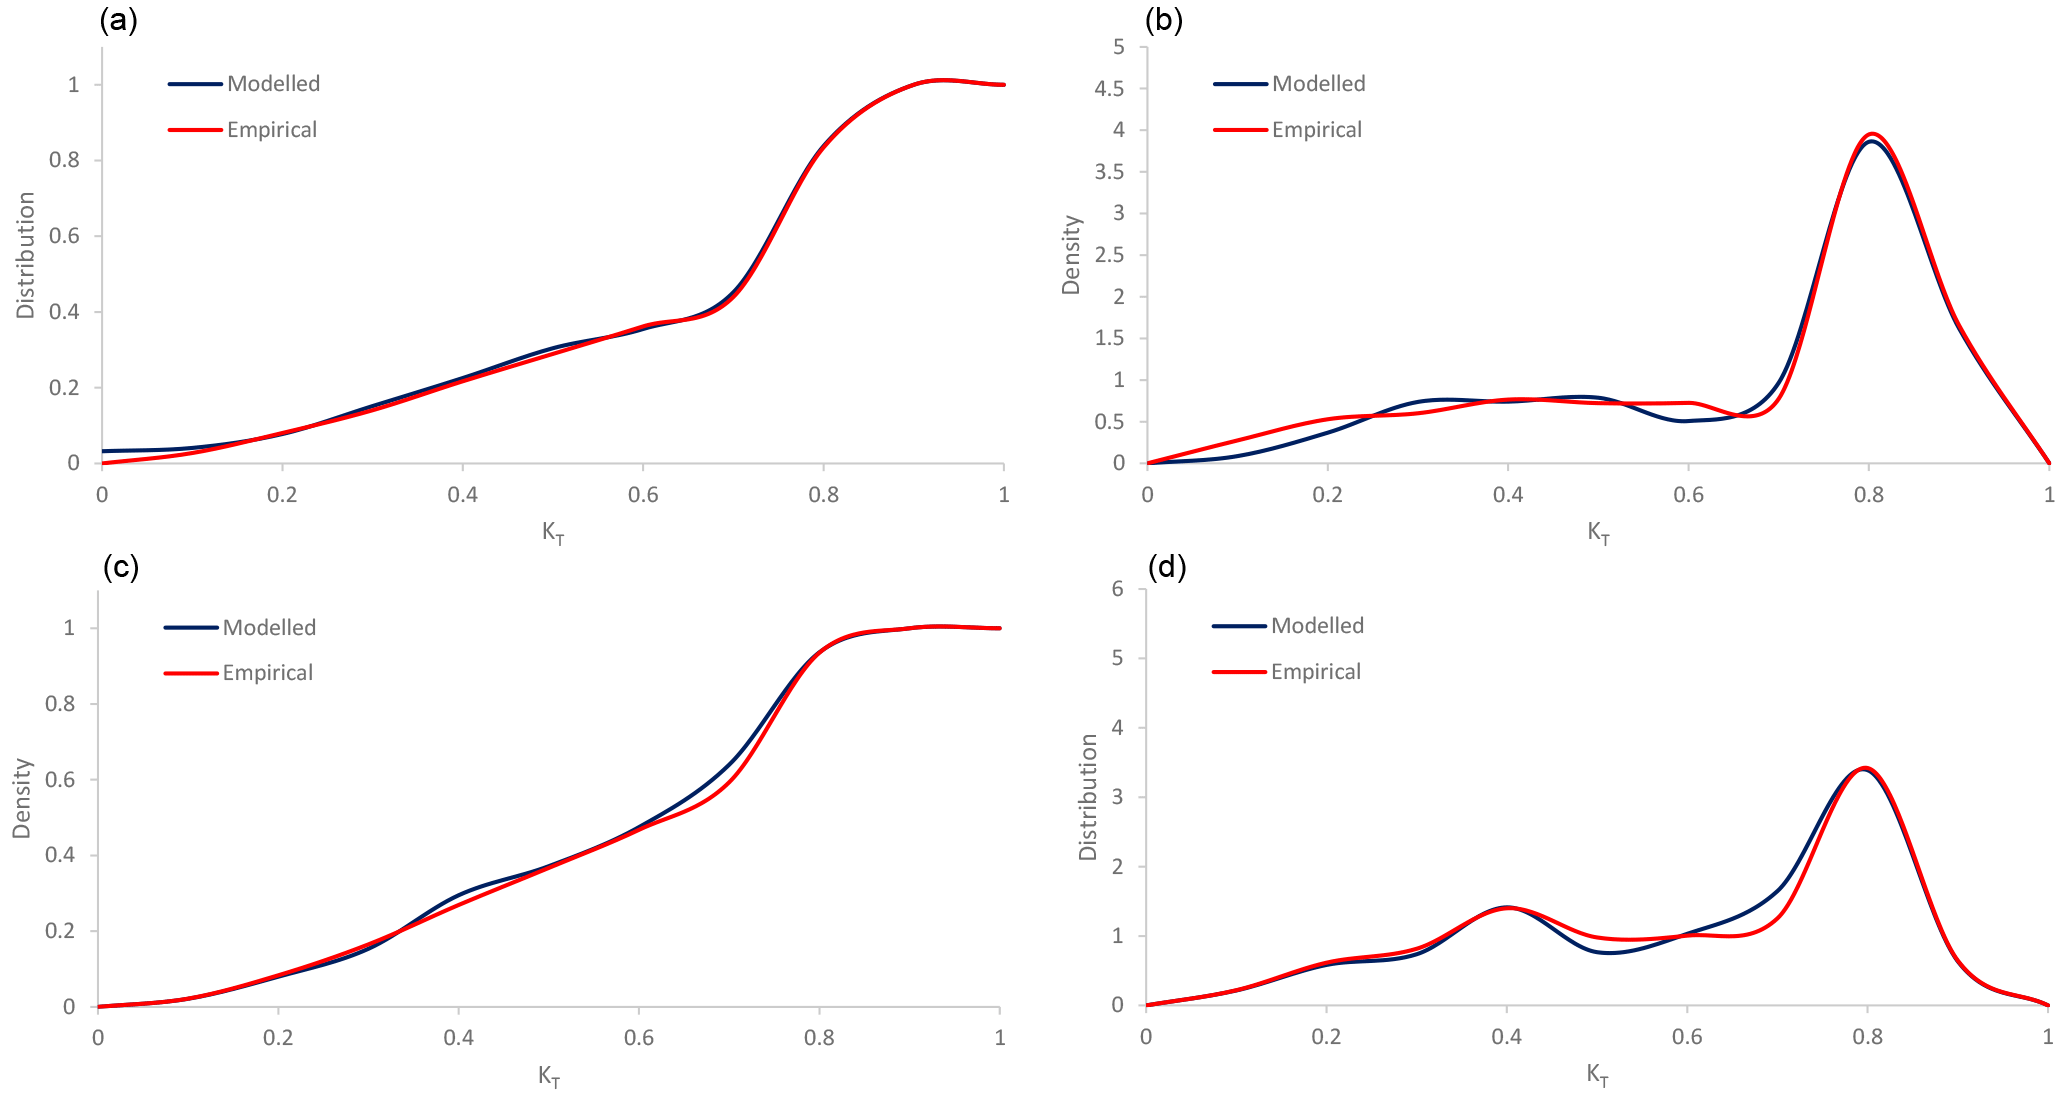
Figure 5Comparison of distribution (a, c) and density (b, d) function of simulated and observed data, for hour 13:00: (a, b) May; (c, d) September.
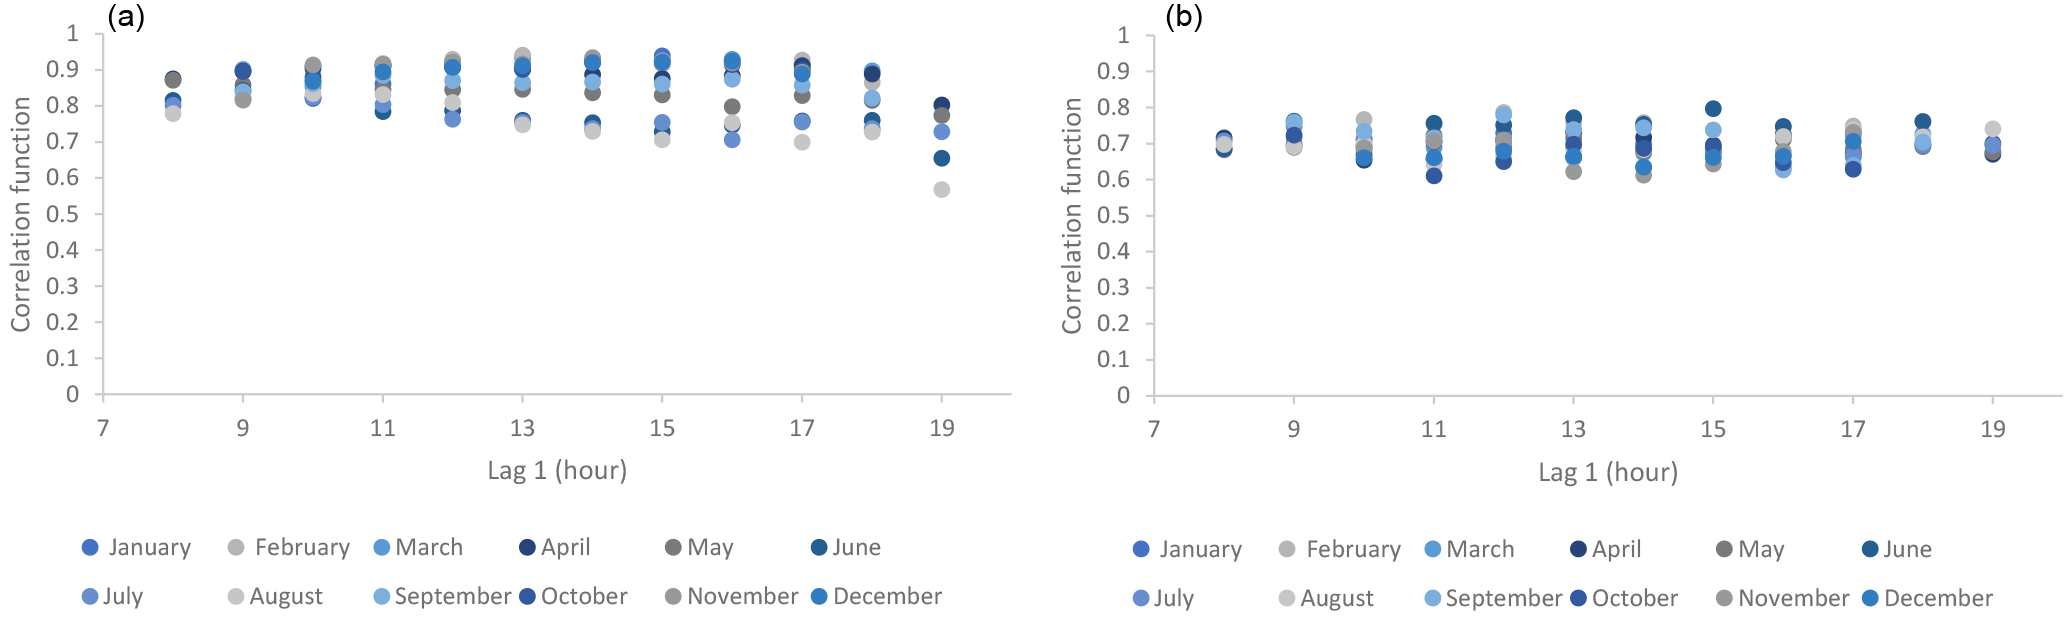
Figure 6Lag-1 autocorrelation of hourly time series for each month (a) empirical; (b) simulated.
The above homogenization enables the estimation and modelling of the dependence structure after the effect of the double periodicity has been approximately removed. This homogenization scheme also enables approximating the correlations among the diurnal processes for the same scale (Fig. 6). After the estimation of the N(0,1) homogenized timeseries, we estimate the dependence structure through the second-order climacogram and we fit a generalized-Hurst Kolmogorov (GHK) model (Dimitriadis and Koutsoyiannis, 2018):
where γ is the standardized variance, k the scale (h), q a scale-parameter and H the Hurst parameter (for the examined process we estimate q=2 and H=0.83, considering the bias effect; Fig. 7).
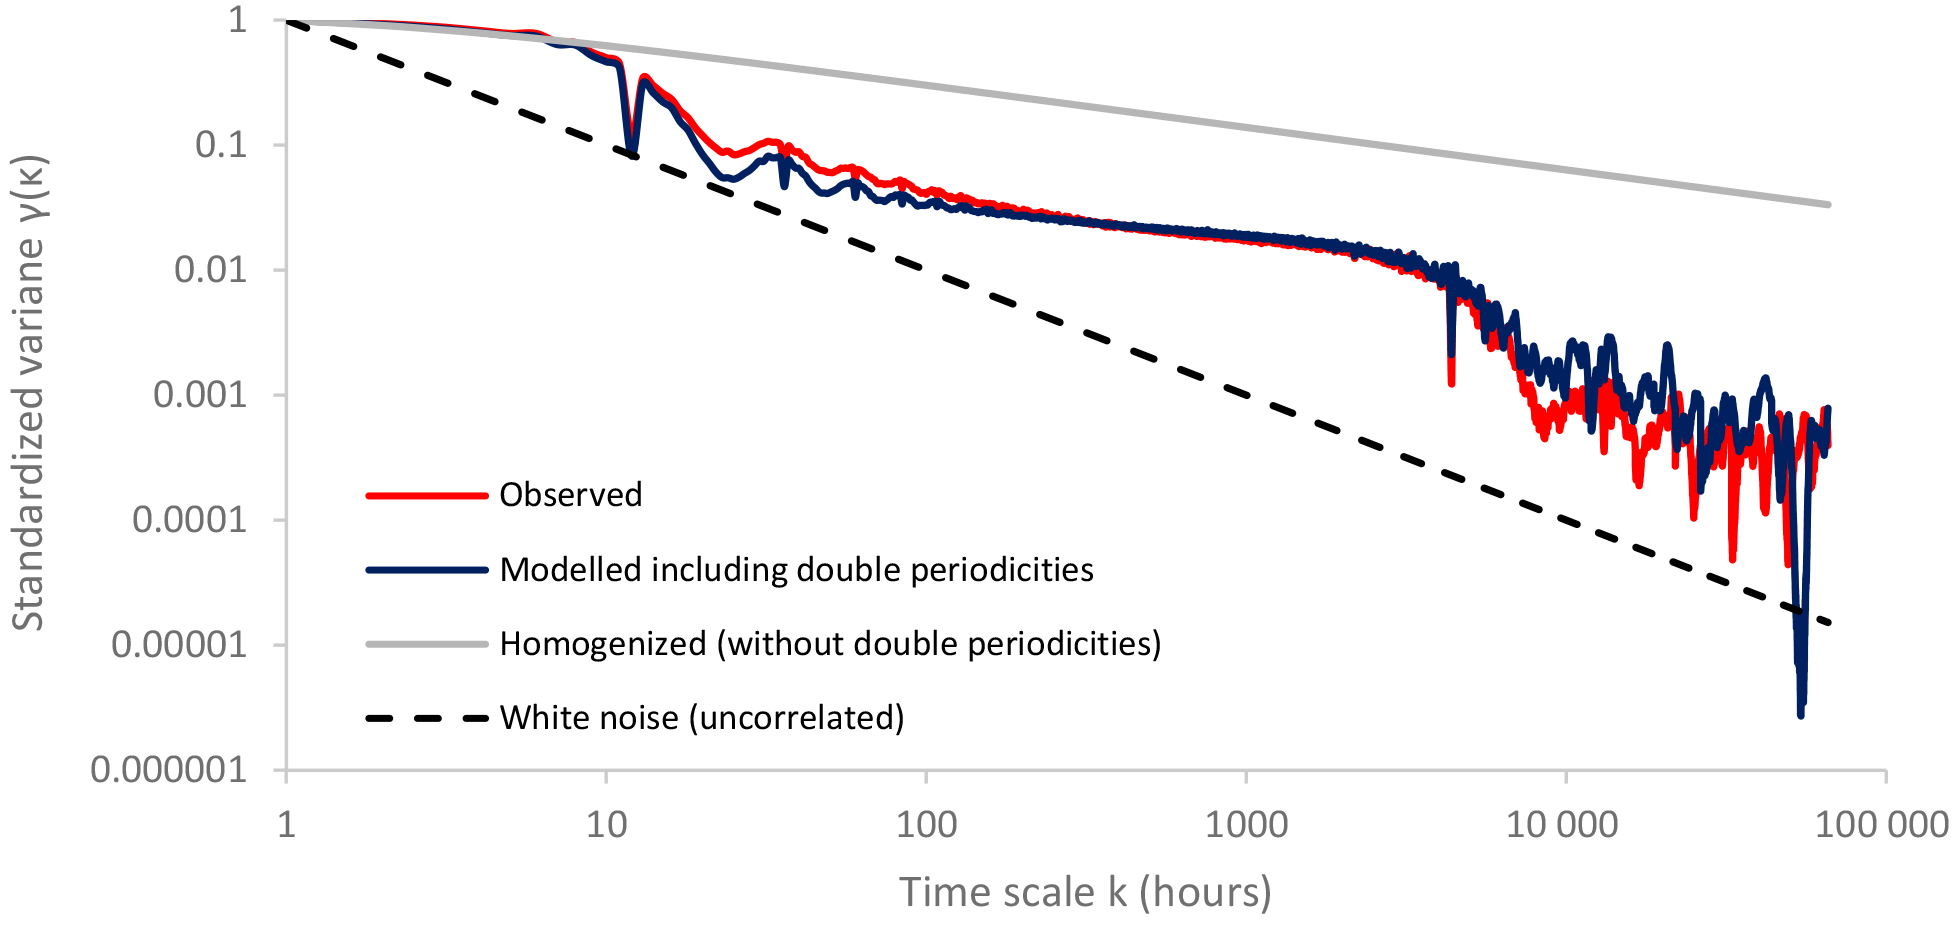
Figure 7Climacogram of observed and simulated KT vs. white noise and a homogenized process without periodicities.
In this implicit manner, the marginal characteristics of each periodic part are exactly preserved (since the marginal distribution functions are implicitly handled through the proposed homogenization) and the expectation of the second-order dependence structure (e.g. correlation function) is also exactly preserved after properly adjusting for bias through the mode or expected value of the estimator (Dimitriadis, 2017). It is noted that higher-order moments of processes with HK behaviour cannot be adequately preserved in an implicit manner (see an illustrative example in Dimitriadis and Koutsoyiannis, 2018, their Appendix D) and thus, for a more accurate preservation of the dependence structure an explicit algorithm is necessary (Dimitriadis and Koutsoyiannis, 2018). We may use a simple generation scheme, such as the sum of AR(1) models (SAR; Dimitriadis and Koutsoyiannis, 2015b), that can synthesize any N(0,1) autoregressive-like dependence structure, which later it can be transformed back to the original distribution function and so in this way produce a double-periodic process with the desired marginal distribution for each diurnal-seasonal cycle as well as the desired dependence structure. Finally, we multiply each value of the synthetic KT with the deterministically determined value of the hourly intensity of solar radiation at the top of the atmosphere.
The hourly marginal distribution of solar radiation is investigated via the clearness index KT. Regarding the marginal distribution, after analysing a variety of stations with different regional climate data, it is concluded that the Kumaraswamy distribution cannot adequately describe the empirical data of hourly solar radiation. Therefore, a new bimodal distribution is constructed which is a weighted sum of two Kumaraswamy distributions This distribution is fully characterized by five parameters and can adequately fit the empirical hourly data of the clearness index in in the regions investigated in this study. Also, the dependence structure of solar radiation process is investigated via the climacogram tool. It is concluded that since the Hurst parameter is estimated higher than 0.5, the examined process exhibits long-term persistence and cannot be considered as a white noise nor a Markov process. Finally, a new preliminary stochastic model is proposed, capable of reproducing the clearness sky index KT and so the hourly solar radiation. The model can maintain and preserve the probability density function by means of the first four central moments and also the Hurst parameter which represents the correlation and the persistent behaviour.
The datasets generated during the current study are available from the corresponding author on reasonable request.
GK conceived of the presented idea, developed the theory and performed the computations. TI helped with R environment statistical tests. PD verified the analytical methods and encouraged GK to investigate the LTP behaviour of the solar radiation process. NM contributed to sample preparation. DK and PD supervised the findings of this work. GK took the lead in writing the manuscript. All authors provided critical feedback and helped shape the research, analysis and manuscript.
The authors declare that they have no conflict of interest.
This article is part of the special issue “European Geosciences Union General Assembly 2018, EGU Division Energy, Resources & Environment (ERE)”. It is a result of the EGU General Assembly 2018, Vienna, Austria, 8–13 April 2018.
The authors thank warmly the anonymous reviewers for their most helpful
comments. The statistical analyses were performed in the R statistical
environment (RDC Team, 2006) by also using the contributed packages VGAM (Yee,
2015), fitdistrplus (Delignette-Muller and Dutang, 2015) and lmomco
(Asquith, 2018).
Edited by: Sonja Martens
Reviewed by: two anonymous referees
Aguiar, R. and Collares-Pereira, M. T. A. G.: TAG: a time-dependent, autoregressive, Gaussian model for generating synthetic hourly radiation, Sol. Energy, 49, 167–174, 1992.
Asquith, W. H.: Lmomco – L-moments, censored L-moments, trimmed L-moments, L-comoments, and many distributions, R package version 2.3.1, Texas Tech University, Lubbock, Texas, USA, 2018.
Ayodele, T. R. and Ogunjuyigbe, A. S. O.: Prediction of monthly average global solar radiation based on statistical distribution of clearness index, Energy, 90, 1733–1742, 2015.
Burnham, K. P. and Anderson, D. R.: Model selection and multimodel inference: a practical information-theoretic approach, Springer Science & Business Media, New York, USA, 2003.
Csorgo, S. and Faraway, J. J.: The exact and asymptotic distributions of Cramér-von Mises statistics, J. Roy. Stat. Soc. B, 58, 221–234, 1996.
Deligiannis, I., Dimitriadis, P., Daskalou, O., Dimakos, Y., and Koutsoyiannis, D.: Global investigation of double periodicity of hourly wind speed for stochastic simulation; application in Greece, Enrgy. Proced., 97, 278–285, 2016.
Delignette-Muller, M. L. and Dutang, C.: fitdistrplus: An R package for fitting distributions, J. Stat. Softw., 64, 1–34, 2015.
Dimitriadis, P.: Hurst-Kolmogorov dynamics in hydrometeorological processes and in the mircoscale turbulence, PhD thesis, National Technical University of Athens, Athens, Greece, 167 pp., 2017.
Dimitriadis, P. and Koutsoyiannis, D.: Climacogram versus autocovariance and power spectrum in stochastic modelling for Markovian and Hurst–Kolmogorov processes, Stoch. Env. Res. Risk A., 29, 1649–1669, 2015a.
Dimitriadis, P. and Koutsoyiannis, D.: Application of stochastic methods to double cyclostationary processes for hourly wind speed simulation, Enrgy. Proced., 76, 406–411, 2015b.
Dimitriadis, P. and Koutsoyiannis, D.: Stochastic synthesis approximating any process dependence and distribution, Stoch. Env. Res. Risk A., 32, 1493–1515, 2018.
Ettoumi, F. Y., Mefti, A., Adane, A., and Bouroubi, M. Y.: Statistical analysis of solar measurements in Algeria using beta distributions, Renew. Energ., 26, 47–67, 2002.
Harrouni, S., Guessoum, A., and Maafi, A.: Classification of daily solar irradiation by fractional analysis of 10-min-means of solar irradiance, Theor. Appl. Climatol., 80, 27–36, 2005.
Hollands, K. G. T. and Huget, R. G.: A probability density function for the clearness index, with applications, Sol. Energy, 30, 195–209, 1983.
Jones, M. C.: Kumaraswamy's distribution: A beta-type distribution with some tractability advantages, Stat. Methodol., 6, 70–81, 2009.
Jurado, M., Caridad, J. M., and Ruiz, V.: Statistical distribution of the clearness index with radiation data integrated over five minute intervals, Sol. Energy, 55, 469–473, 1995.
Koudouris, G., Dimitriadis, P., Iliopoulou, T., Mamassis, N., and Koutsoyiannis, D.: Investigation on the stochastic nature of the solar radiation process, Enrgy. Proced., 125, 398–404, 2017.
Koutsoyiannis, D.: The Hurst phenomenon and fractional Gaussian noise made easy, Hydrolog. Sci. J., 47, 573–595, 2002.
Koutsoyiannis, D.: HESS Opinions “A random walk on water”, Hydrol. Earth Syst. Sci., 14, 585–601, https://doi.org/10.5194/hess-14-585-2010, 2010.
Koutsoyiannis, D.: Hurst–Kolmogorov dynamics as a result of extremal entropy production, Physica A, 390, 1424–143, 2011.
Koutsoyiannis, D., Yao, H.. and Georgakakos, A.: Medium-range flow prediction for the Nile: a comparison of stochastic and deterministic methods, Hydrolog. Sci. J., 53, 142–164, 2008.
Marsaglia, G. and Marsaglia, J.: Evaluating the anderson-darling distribution, J. Stat. Softw., 9, 1–5, 2004.
Moschos, E., Manou, G., Dimitriadis, P., Afentoulis, V., Koutsoyiannis, D., and Tsoukala, V. K.: Harnessing wind and wave resources for a Hybrid Renewable Energy System in remote islands: a combined stochastic and deterministic approach, Enrgy. Proced., 125, 415–424, 2017.
Pizarro, A., Dimitriadis, P., Chalakatevaki, M., Samela, C., Manfreda, S., and Koutsoyiannis, D.: An integrated stochastic model of the river discharge process with emphasis on floods and bridge scour, European Geosciences Union General Assembly 2018, vol. 20, 11 April 2018, Vienna, Austria, EGU2018-8271, 2018.
Reno, M. J., Hansen, C. W., and Stein, J. S.: Global horizontal irradiance clear sky models: Implementation and analysis, Tech. Rep. SAND2012-2389, Sandia National Laboratories, Albuquerque, New Mexico and Livermore, California, USA, 2012.
RDC Team (R Development Core Team): R: A Language and Environment for Statistical Computing, R Foundation for Statistical Computing, Vienna, Austria, 2006.
Tovar-Pescador, J.: Modelling the statistical properties of solar radiation and proposal of a technique based on boltzmann statistics, in: Modeling Solar Radiation at the Earth's Surface, Springer, Berlin, Heidelberg, Germany, 55–91, 2008.
Tsekouras, G. and Koutsoyiannis, D.: Stochastic analysis and simulation of hydrometeorological processes associated with wind and solar energy, Renew. Energ., 63, 624–633, 2014.
Yee, T. W.: Vector generalized linear and additive models: with an implementation in R, Springer, New York, USA, 2015.